Skip to content

Manufacturing

Manufacturing businesses generate huge volumes of data. But the complex nature of the manufacturing process makes it challenging to track and analyze data to make data-driven decisions. Vatsa’s powerful Manufacturing dashboard, built on Microsoft’s Power BI, helps manufacturers extract actionable insights from their complex datasets. Utilizing advanced analytics techniques or industrial dashboards, manufacturers can seamlessly uncover patterns, identify bottlenecks, monitor performance, analyze historical data, optimize workflows, and enhance overall performance.

Real-Time Performance and Production Monitoring Dashboard

The Real-Time Performance and Production Monitoring (RTPPM) dashboard plays a major role in the real-time monitoring analysis of your performance data. It provides detailed insights and enables you to optimize your performance with efficient decisions.

Asset Monitoring and Utilization Dashboard

The Asset Monitoring and Utilization (AMU) dashboard provides details to enable proactive maintenance, optimized asset utilization, and asset management. These actions help extend asset lifespan, better ROI, and improve efficiency.

KPI Dashboard

The KPI dashboard offers details on the Overall Equipment Efficiency (OEE) such as availability, performance, quality, and more. It allows for detailed inspection to understand with better context and identify areas of improvement.

Operator dashboard

The Operations dashboard provides information on alarm events like which equipment rang the alarm, the duration of the alarm, if any user has acknowledged it, and the severity of the alarm. Obtain critical data about current and historical plant information, including equipment downtime and waste.

Report dashboard

With the Report Dashboard, get daily KPI trends based on OEE, availability, performance, and quality, along with details on utilization by hours, etc.


Asset Monitoring and Utilization (AMU) Dashboard

Asset Monitoring Dashboard

The Asset Monitoring dashboard offers data points on production, rejection, energy, and active alarm for equipment such as CNC mill, coat painter, gentry robot, grinder, laser cutter, and more.

Operations Dashboard

The Operations dashboard provides information on alarm events like which equipment rang the alarm, the duration of the alarm, if any user has acknowledged it, and the severity of the alarm

Alarms dashboard

The Alarms dashboard provides all the important details regarding the alarms like the number of alarms, alarm severity, and equipment.

Notification Report

The Notification Report dashboard displays details on the number of notifications received, equipment that raised notifications, and which personnel attended the notifications.

Key Features

Optimize your manufacturing operations with our powerful Power BI dashboards.

Why Vatsa?

1

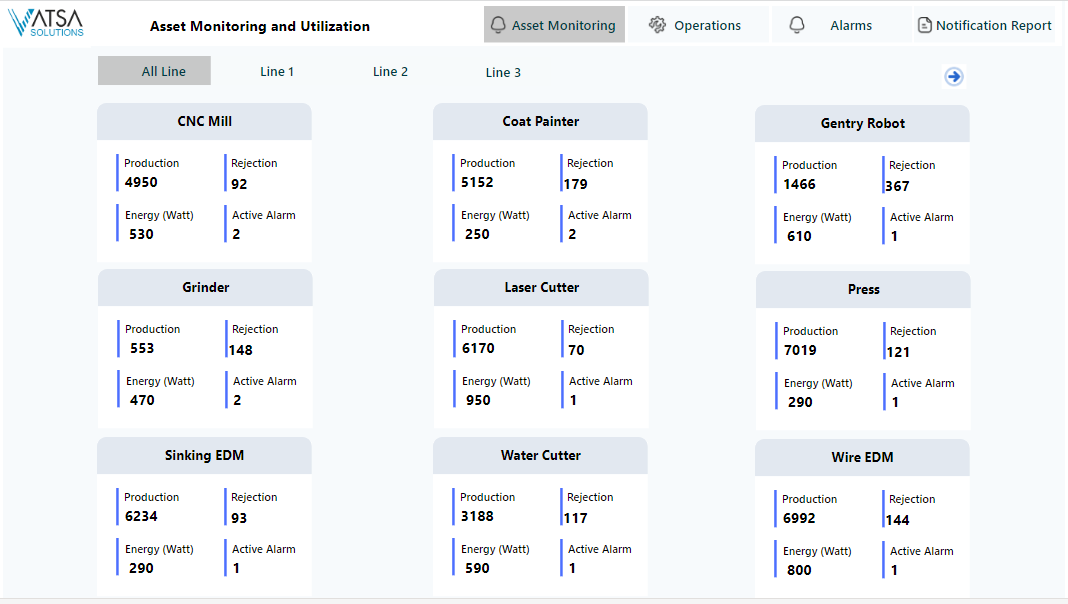
Simplified overview of the machine status for equipment and components with the extensive asset monitoring dashboard

2

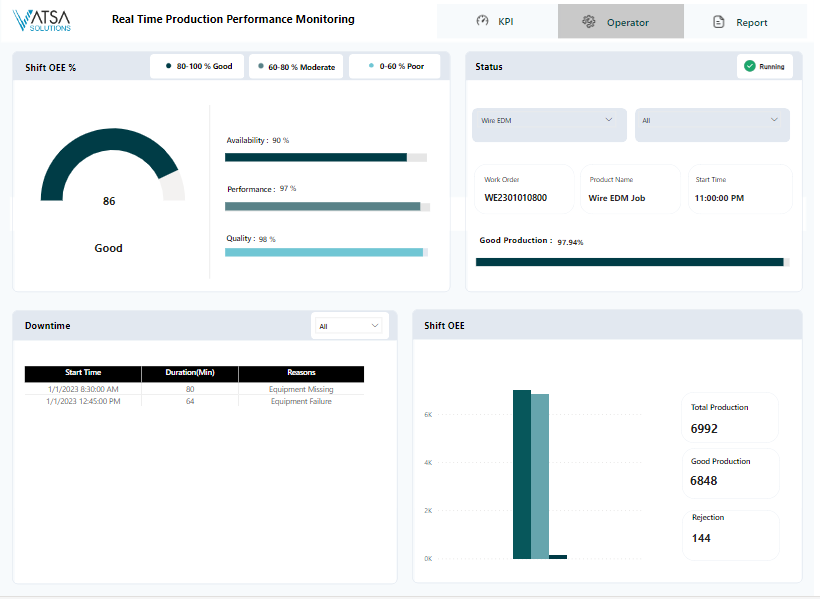
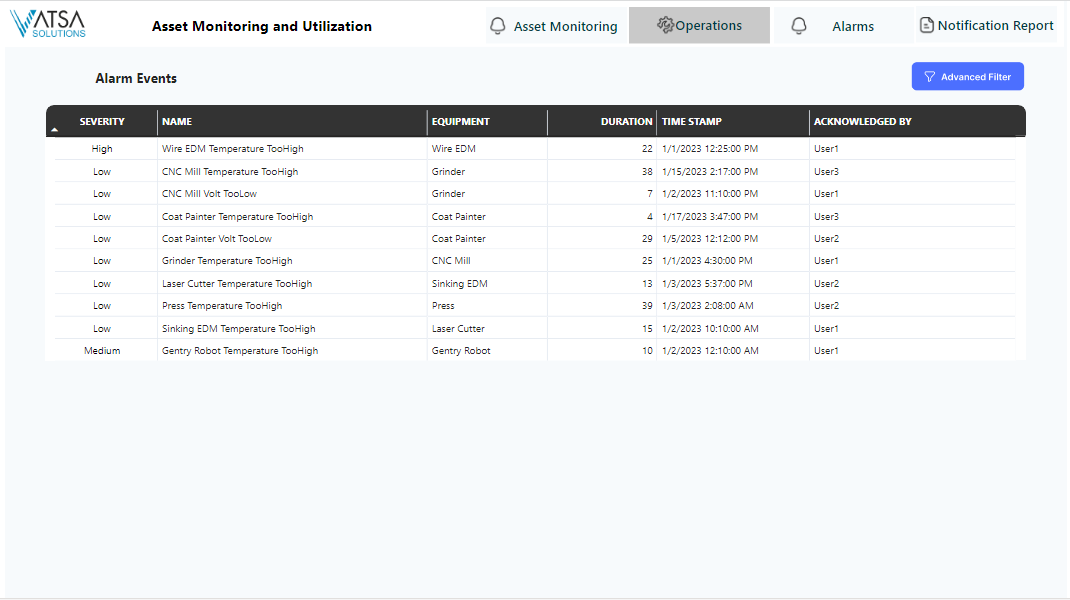
In-depth insights on current and historical plant information, including equipment downtime and waste

3

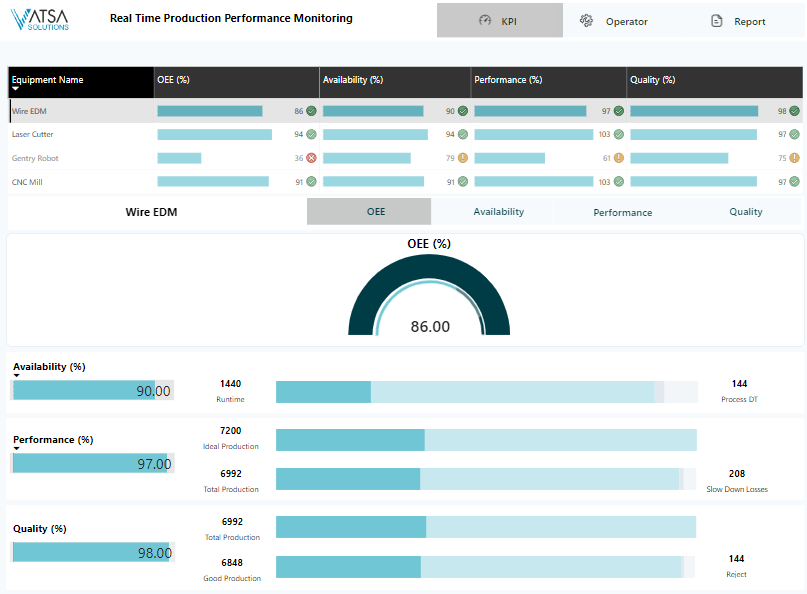
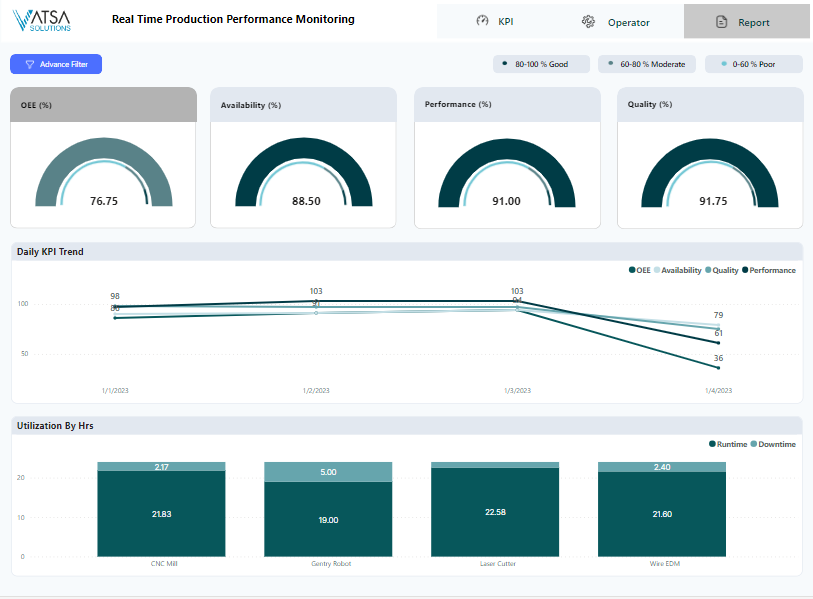
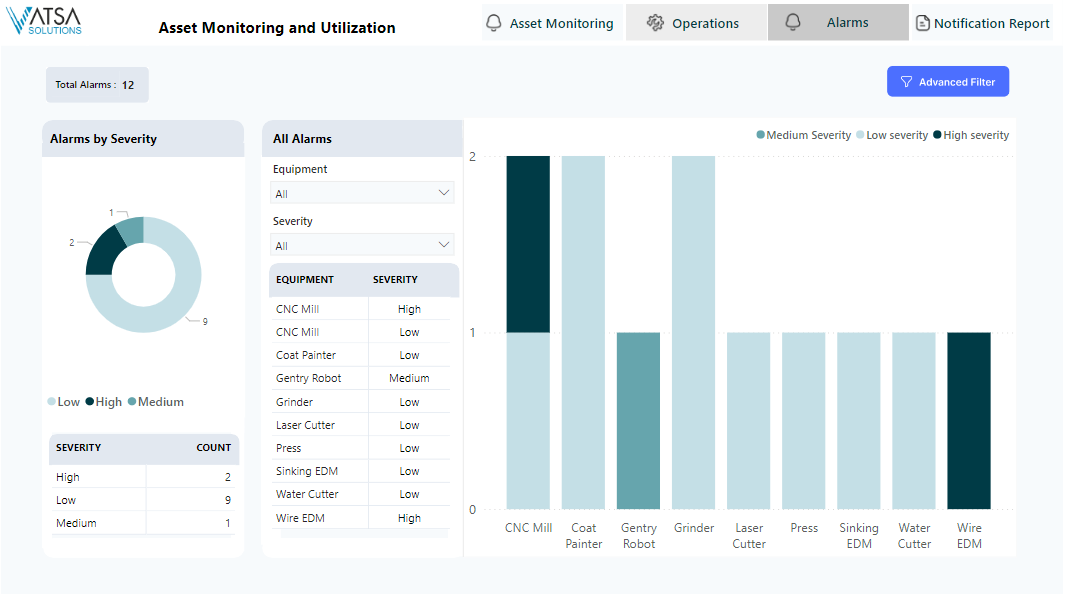
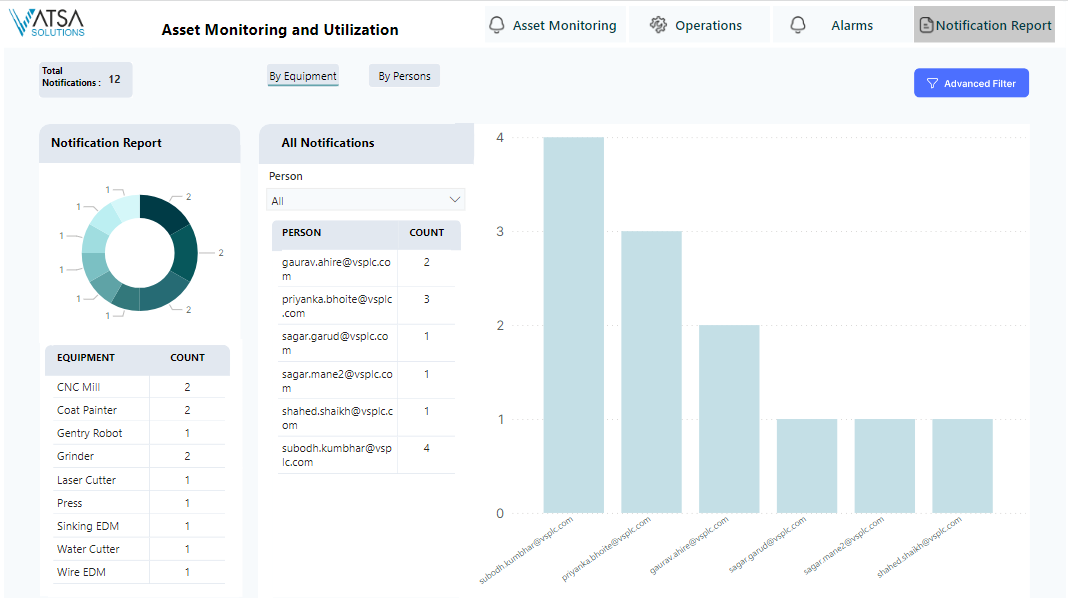
Improved supply chain competencies with a KPI dashboard and data-driven decisions

4

Real-time insights on production, waste, downtime information

Supercharge your manufacturing processes with our tailored Power BI solutions.