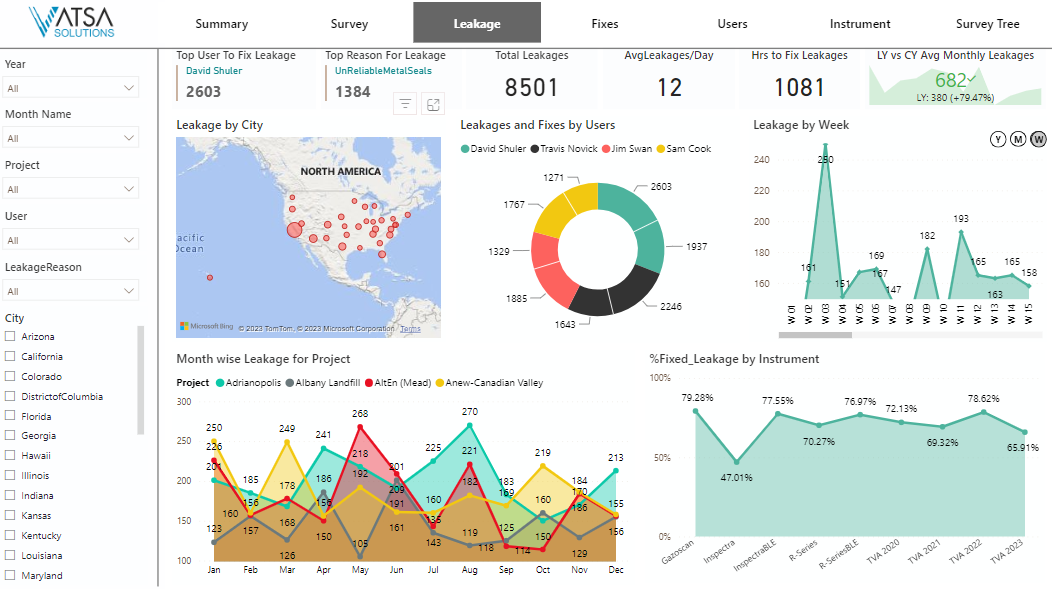
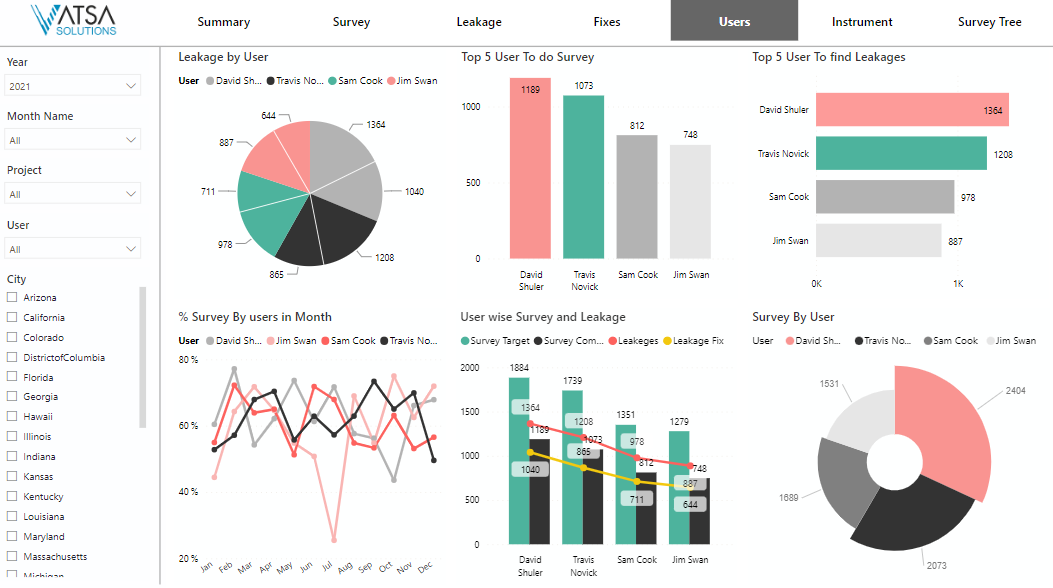
Oil & Gas
Oil & Gas Live Dashboard
Key Features
- Build and edit reports on various aspects of the operations, such as production levels, equipment performance, safety metrics, and more
- Access real-time data through interactive dashboards, allowing users to monitor critical factors like performance, exploration activities, asset maintenance, and safety records.
- Get comprehensive insights from analytical reports on various metrics such as revenue streams, cost analysis, supply chain optimization, and more
- Automatically update the dashboard as new data is introduced in the database
Take data-driven decisions for supercharged productivity
Summary Dashboard
With actionable insights, the Summary dashboard enables users to optimize operations and drive strategic decision-making. It provides valuable business insights by analyzing critical data points such as survey and leakage by project, fixed leakage, leakage by gas type, survey and leakages by date, and more.
Survey Dashboard
The Survey dashboard provides users with valuable insights from employee and customer surveys for informed decision-making. Users can analyze various surveys like surveys conducted by cities or projects, surveys in a month or year, and more. This enables managers and executives to identify areas of improvement, implement targeted action plans, and drive positive change.
Leakage Dashboard
The Leakage dashboard enables users to proactively detect and address leaks in their operations, ensuring safety, environmental compliance, and operational efficiency. Users can monitor key parameters like leakages by city, leakage by time, leakage fixes by users, and more. This enables operators to take immediate action, initiate preventive maintenance, and minimize the risk of environmental incidents.
Fixes Dashboard
The Fixes dashboard enables streamlining maintenance and repair processes with actionable insights. Users can monitor multiple data points like time to fix a leakage by instrument for the project (in hours), leakage fixed by gas type, fixes by month, leakage fixed by user, leakages and minimum, maximum, and average time to fix leakages, and more.
Users Dashboard
The users dashboard empowers Oil & Gas companies to manage and optimize user access and permissions for enhanced security and data governance. By providing a centralized view of user to do survey, top 5 user to find leakages, % survey by users in month, user wide survey and leakage, survey by users, etc.
Instrument Dashboard
The instrument dashboard empowers Oil & Gas operators to promptly identify potential issues, schedule maintenance activities, and optimize instrument utilization. By providing real-time insights into leakage by instrument, leakage of gastype and user, % of survey by instrument and GPS instruments, etc.
Why Vatsa?

Proactively address issues with real-time insights from collated survey data

Improved safety of employees and risk mitigation

Enhanced efficiency with seamless data collection, analysis, and reporting
