List Visualizer
Most effective visualization for SharePoint data
for SharePoint data
Visualize SharePoint Data
Unlock hidden insights from the data by visualising the SharePoint List and Library data in the form of beautiful charts entries.
Instantly filter data
Experience lightning fast smart filters that change dynamically depending on the data loaded.
Aggregate and group data
Run aggregate functions and grouping on list data on the fly. See the changes taking effect instantly on charts.
ListVisualizer helps your accumulated data in SharePoint represent in a visual format, thereby enabling you to reveal the hidden insights quicker. List Visualizer is a SharePoint-based add-in, which helps you in rephrasing your data in various visual formats like colorful charts, simple graphs and bar diagrams, and also helps you to filter and group your data as required. List Visualizer is an intelligent add-in which eliminates the need to export your data to third party data sheets to create such visuals, thereby reducing your overall time and efforts and thus boosting productivity.
Bar Graph
While representing larger data sets, you can opt for a Bar Graph option in ListVisualizer. Bar Graphs further improve the readability of your data and is useful for data sets with multiple entries.
Column Graph
For smaller data sets and data sets with negative values, ListVisualizer has the ability to convert your data into a colorful Column Graph for better visibility and easy representation.
Line Graph
ListVisualizer takes your complex and bulk list data and smartly converts it into an easily readable Line Graph, enabling you to easily compare between multiple data points.
Pie Chart
ListVisualizer aids you to summarize your mass data into a colorful Pie Chart which enables you to visually check the accuracy of your data, all with no or minimal additional explanation.
Simplified List
ListVisualizer enables you to sort and filter a simple List View from your bulky data for effective data management and lets you focus on the filtered data points.
How to Install
From now on, the Virto Forms icon is displayed on the ribbon pane. so you can start the app directly from your Lists or Document Libraries.
Alternatively, you can start the app from site contents of the site, where you installed the app, by clicking the Forms Pro icon

From now on, the Virto Forms icon is displayed on the ribbon pane. so you can start the app directly from your Lists or Document Libraries.
Alternatively, you can start the app from site contents of the site, where you installed the app, by clicking the Forms Pro icon

From now on, the Virto Forms icon is displayed on the ribbon pane. so you can start the app directly from your Lists or Document Libraries.
Alternatively, you can start the app from site contents of the site, where you installed the app, by clicking the Forms Pro icon

How to use?
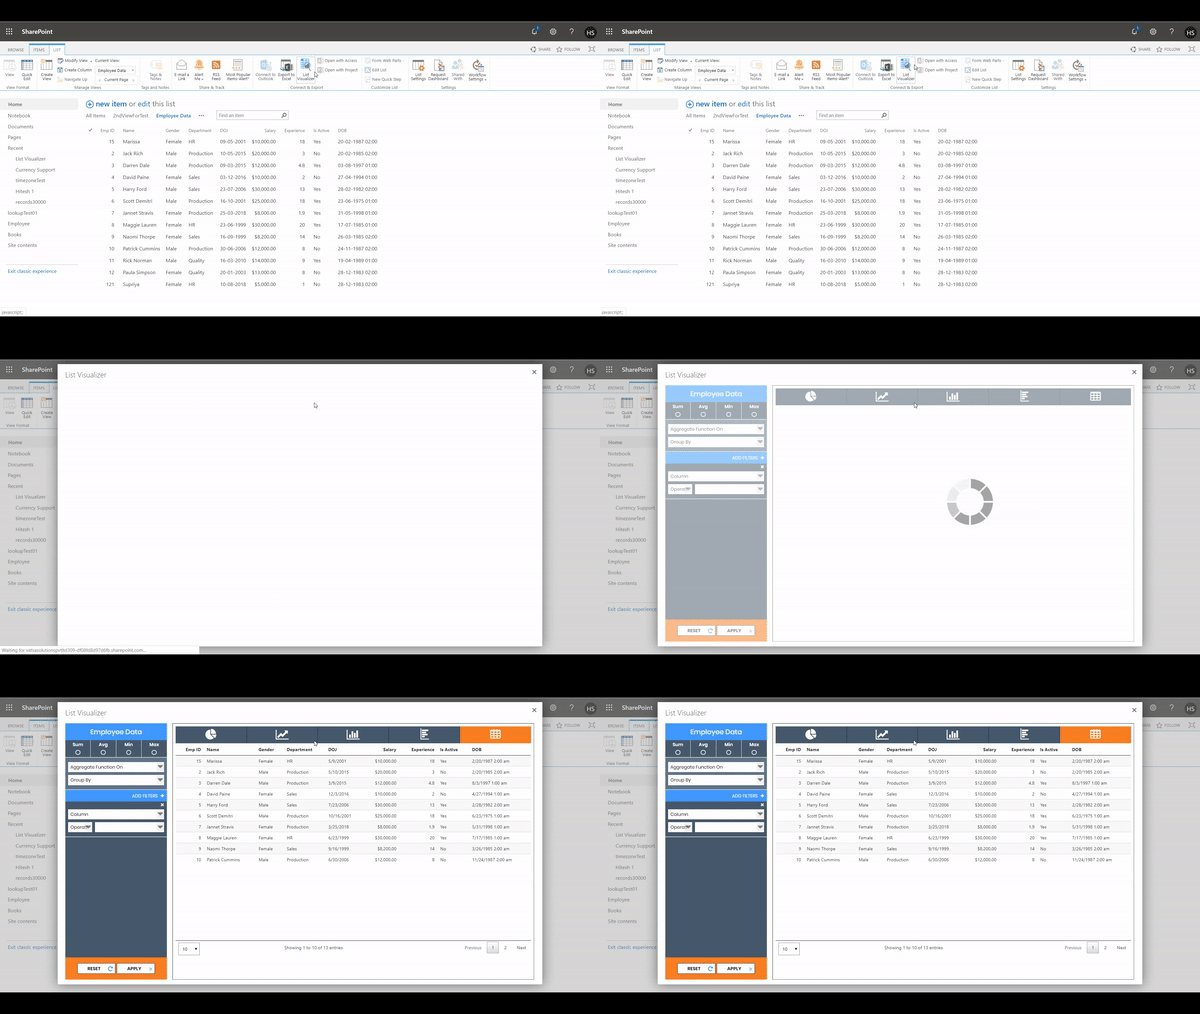
Open any SharePoint List
Locate List Visualizer
Classic View
In classic view List Visualizer launch icon can be found in List ribbon menu of the list opened currently
Modern View
In Modern View, it can be found in the menu strip just above the name of the list opened currently.

Launch
Clicking on the icon with open launch List Visualizer UI.
In classic view, it is seen as amodal dialog over the list page.
In Modern View, it take takes the entire page and is not seen as modal dialog.

Aggregate and Group
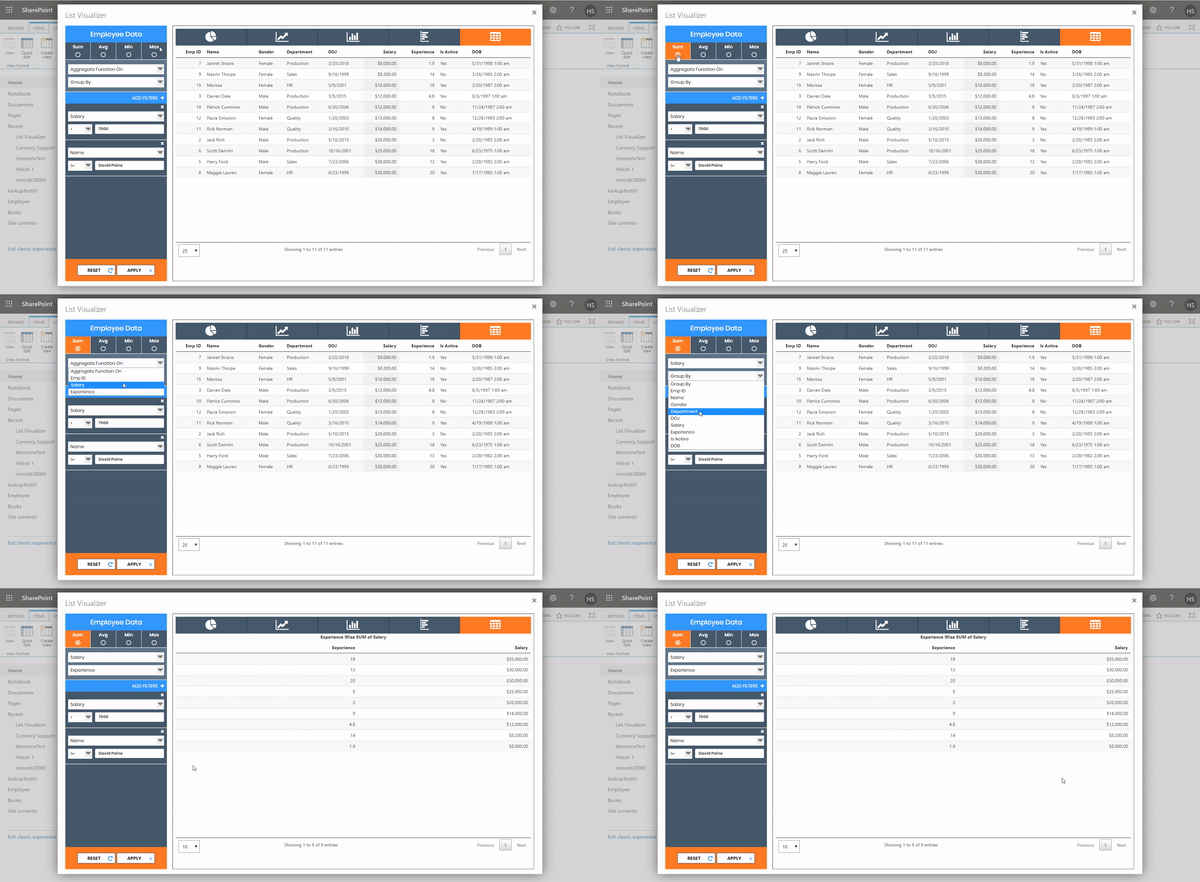
Select from aggregate options such as Sum, Average, Minimum, Maximum to apply on a column of list and by which group you would like to apply that option on.


Filters
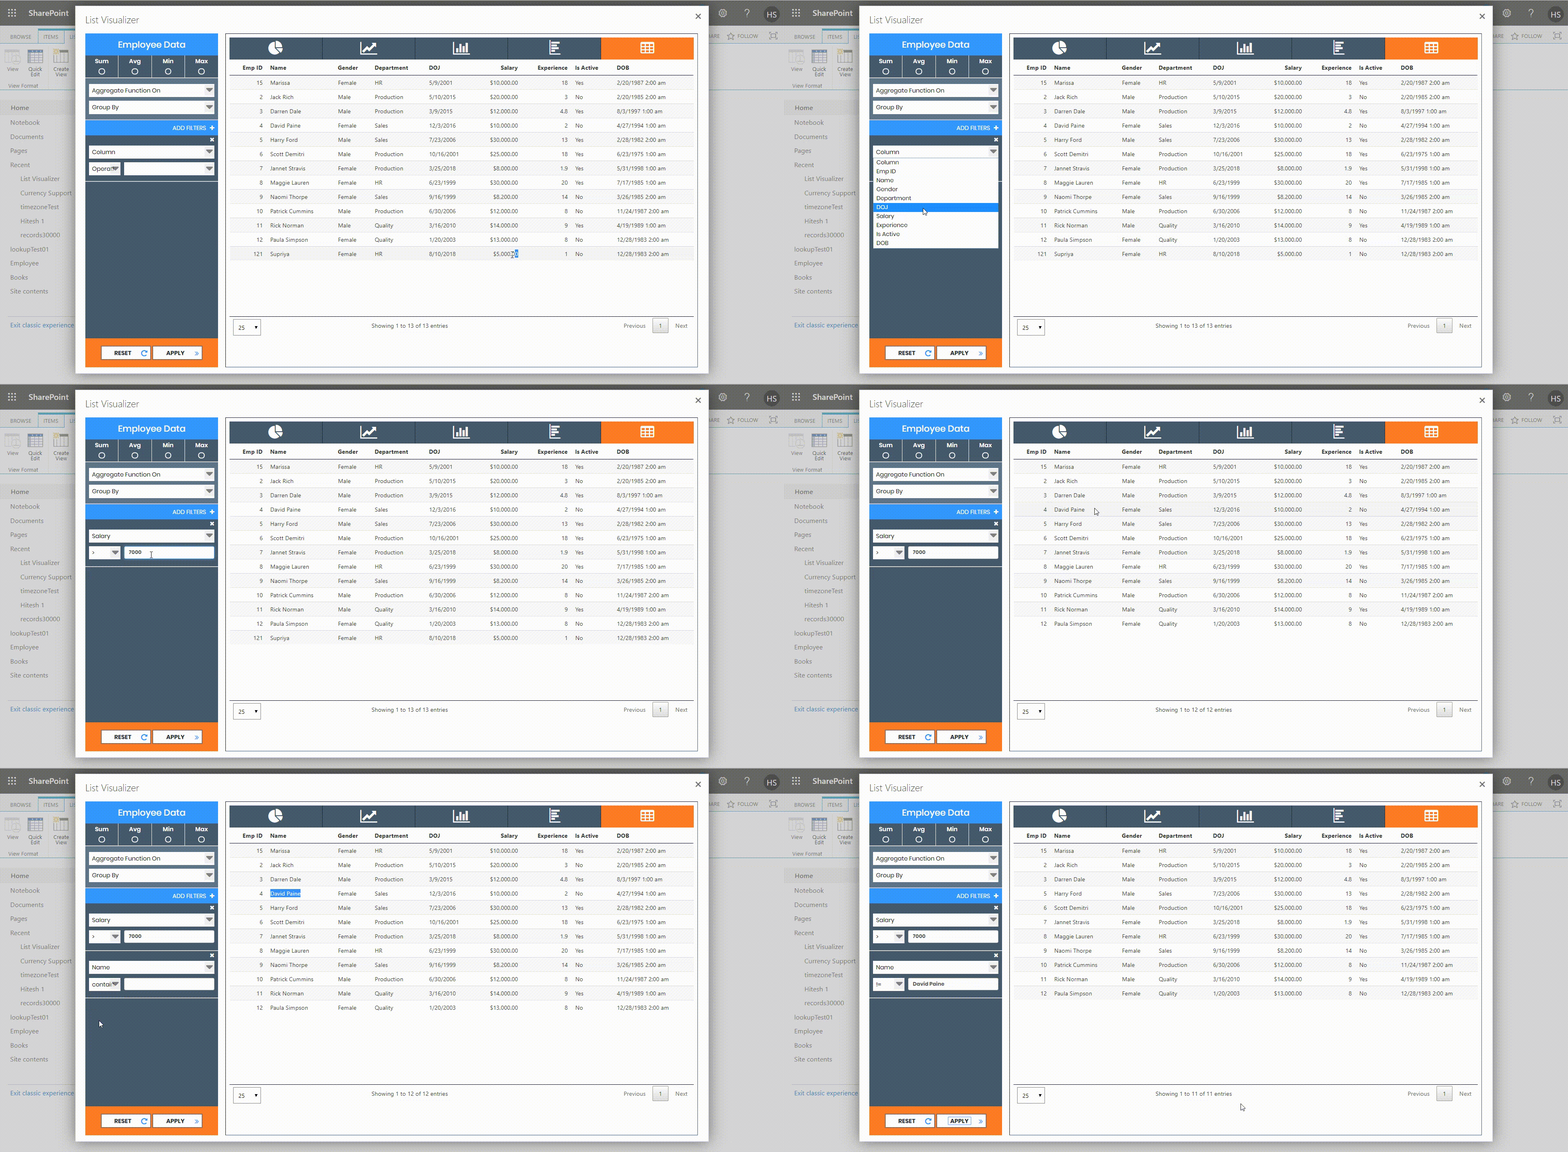
User smart filters to choose data at lighting fast speed. With smart algorithms in place, filters make optimized use of memory to deliver best user experience. The operators and possible values are relevant to the data type of field selected for filter

Visualize
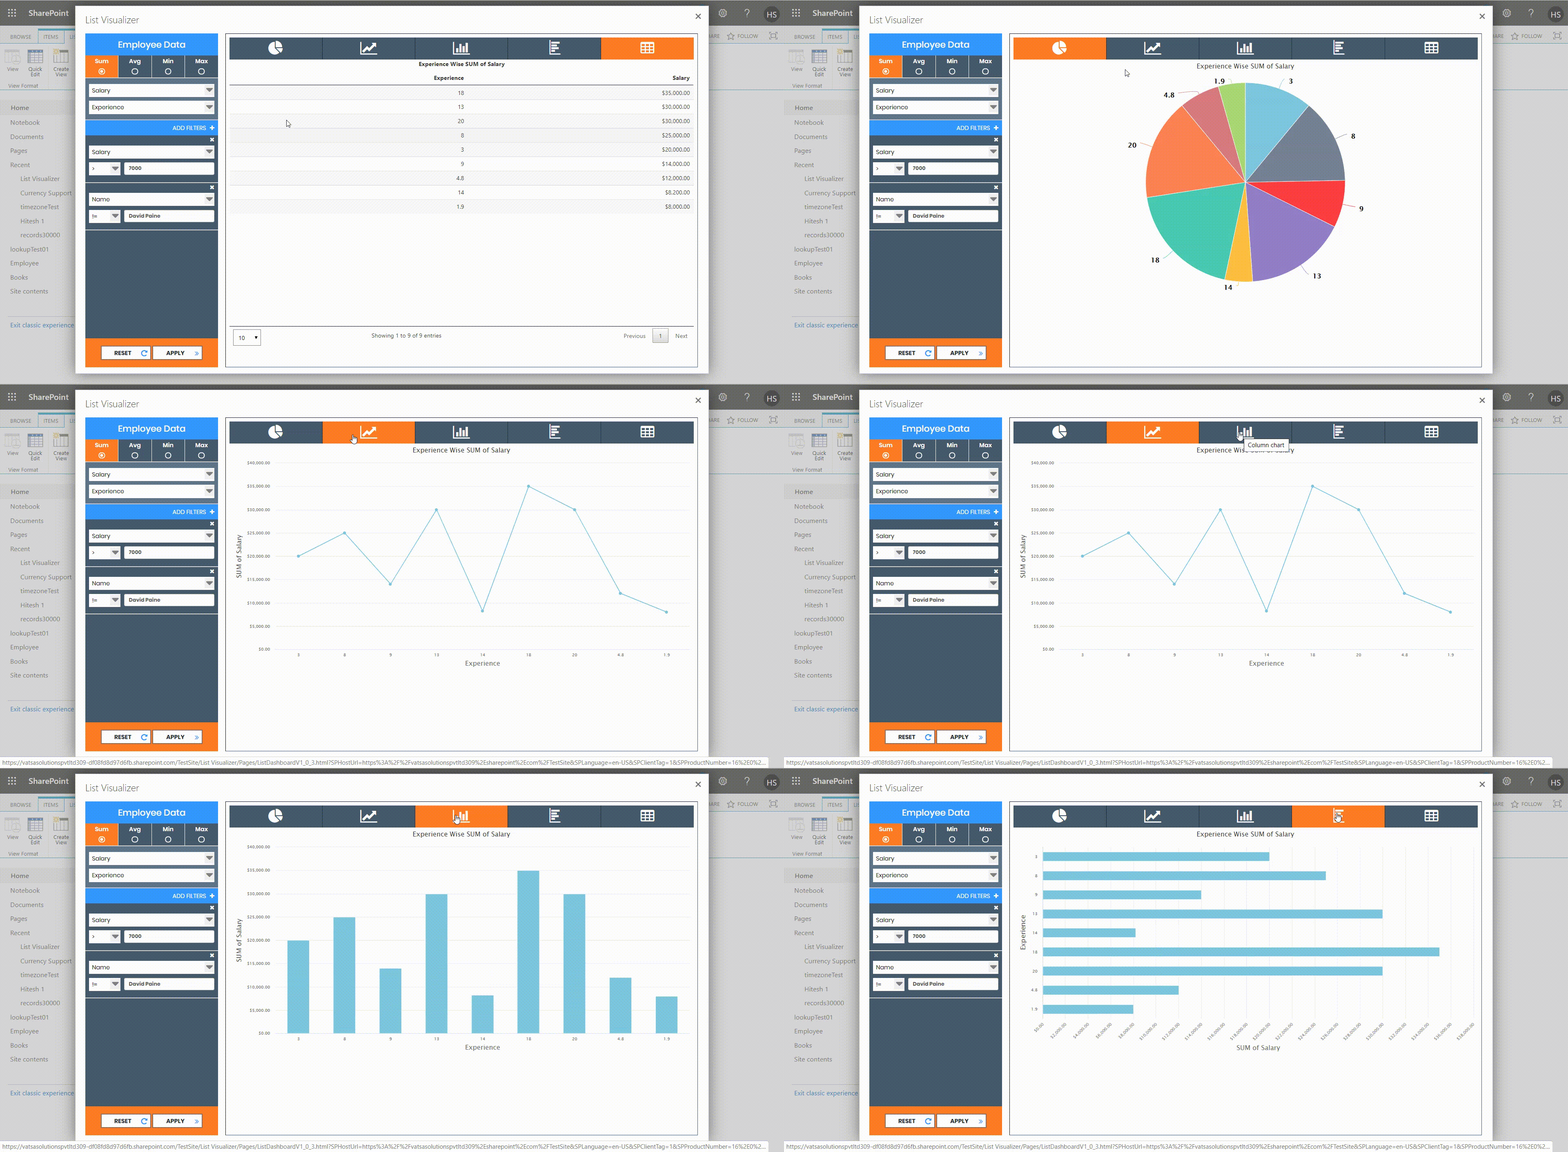
View the data in different visual chart forms such as Pie, Line, Column, Bar. Experience smooth transition from one type to another and unlock true insights from your SharePoint data.
